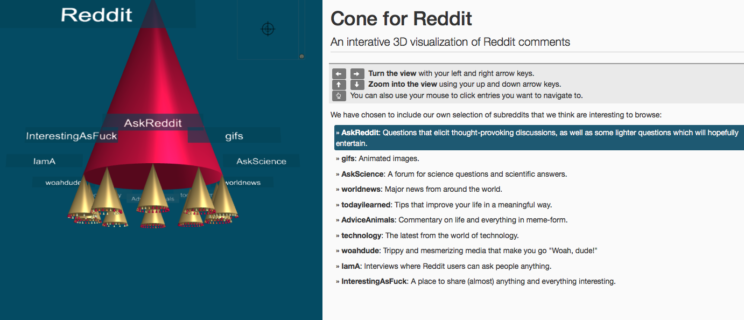
Reddit discussion live data in 3D with ConeCanvas
Let me show you a 3D visualisation that we’re very excited to relase today: It’s our new app, an it’s called Cone for Reddit.
What’s Reddit? An online community where members vote on submitted content to find the best new stuff, and have insightful and funny discussions about it. We all love that site and spend way too much time browsing there. So it was obvious that we would have to make a custom client using our ConeCanvas visualisation library.
ConeCanvas is built to ease exploration and re-ordering of large structured data-sets. While we will not re-order Reddit right now, it is obvious how the community’s content, which is of a highly hierarchical nature, is so well suited to be displayed using ConeCanvas.

As there already was a Haskell library for Reddit out there (dibs to intolerable), it was quite straightforward to use its definitions for this project. Our app crawls posts and comments from a custom selection of 10 really interesting subreddits and parses them into a tree structure. This tree is the base for ConeCanvas: it allows you to understand the discussion structure of a reddit thread at a glimpse. Reddit’s user votings on single posts are reflected by a heatmap-like color scheme, enabling you to grasp in an instant where the discussion in that particular thread is headed.
ConeCanvas can be navigated with the keyboard, by mouse clicks and also by using touch gestures on a mobile device. The App not only displays the text and comments, but also embeds linked pictures and gifs directly inside the app.
Go try it out right now, it’s really fun to use! Feel free to send us an email or leave a comment here if you have any suggestions or feedback about the idea.
Click here for the live demo of Cone for Reddit.
If you’re curious, check out the source code: https://github.com/Symbolian/cone-reddit
